Deeplab SNMS
Server & Network Monitoring System
A comprehensive Integrated ICT Operations & Monitoring System engineered to ensure network stability, optimize IT support and enhance internal ICT communication.
System Overview
Deeplab SNMS delivers real-time server and network status monitoring, automatically calculates network availability and generates detailed network log reports.
Key Capabilities
Real-time Monitoring
Continuous surveillance of all network devices, servers and critical infrastructure components
- Server Health Monitoring
- Network Traffic Analysis
- Bandwidth Utilization
- Service Status Tracking
- Performance Metrics
Automatic Availability
Automatically calculates network and server availability percentages with SLA compliance tracking
- Uptime/Downtime Tracking
- SLA Compliance Reports
- Historical Availability Data
- Performance Benchmarks
- Trend Analysis
Issue Tracking System
Comprehensive ticketing system for network and server-related problems with resolution tracking
- Automatic Ticket Generation
- Priority Classification
- Resolution Time Tracking
- Escalation Procedures
- Knowledge Base Integration
Smart Alert System
Multi-channel notification system that promptly alerts ICT personnel of critical issues
- Email Notifications
- SMS Alerts
- Mobile Push Notifications
- Escalation Matrix
- Custom Alert Rules
Port & Service Monitoring
Advanced monitoring of specific ports, services and application performance
- TCP/UDP Port Monitoring
- Service Response Time
- Application Performance
- Database Connectivity
- Web Service Monitoring
Reporting & Analytics
Comprehensive reporting system with detailed network logs and performance analysis
- Network Log Reports
- Performance Analysis
- Capacity Planning
- Trend Forecasting
- Executive Dashboards
Monitoring Process
Discovery & Configuration
Automatic discovery of network devices and servers with customizable monitoring thresholds
Continuous Monitoring
24/7 monitoring of all configured devices, services and applications
Alert Generation
Automatic generation of alerts when thresholds are breached or issues detected
Issue Resolution
Tracking and resolution of all reported issues with performance analysis
Reporting & Analysis
Comprehensive reporting and analytics for performance improvement
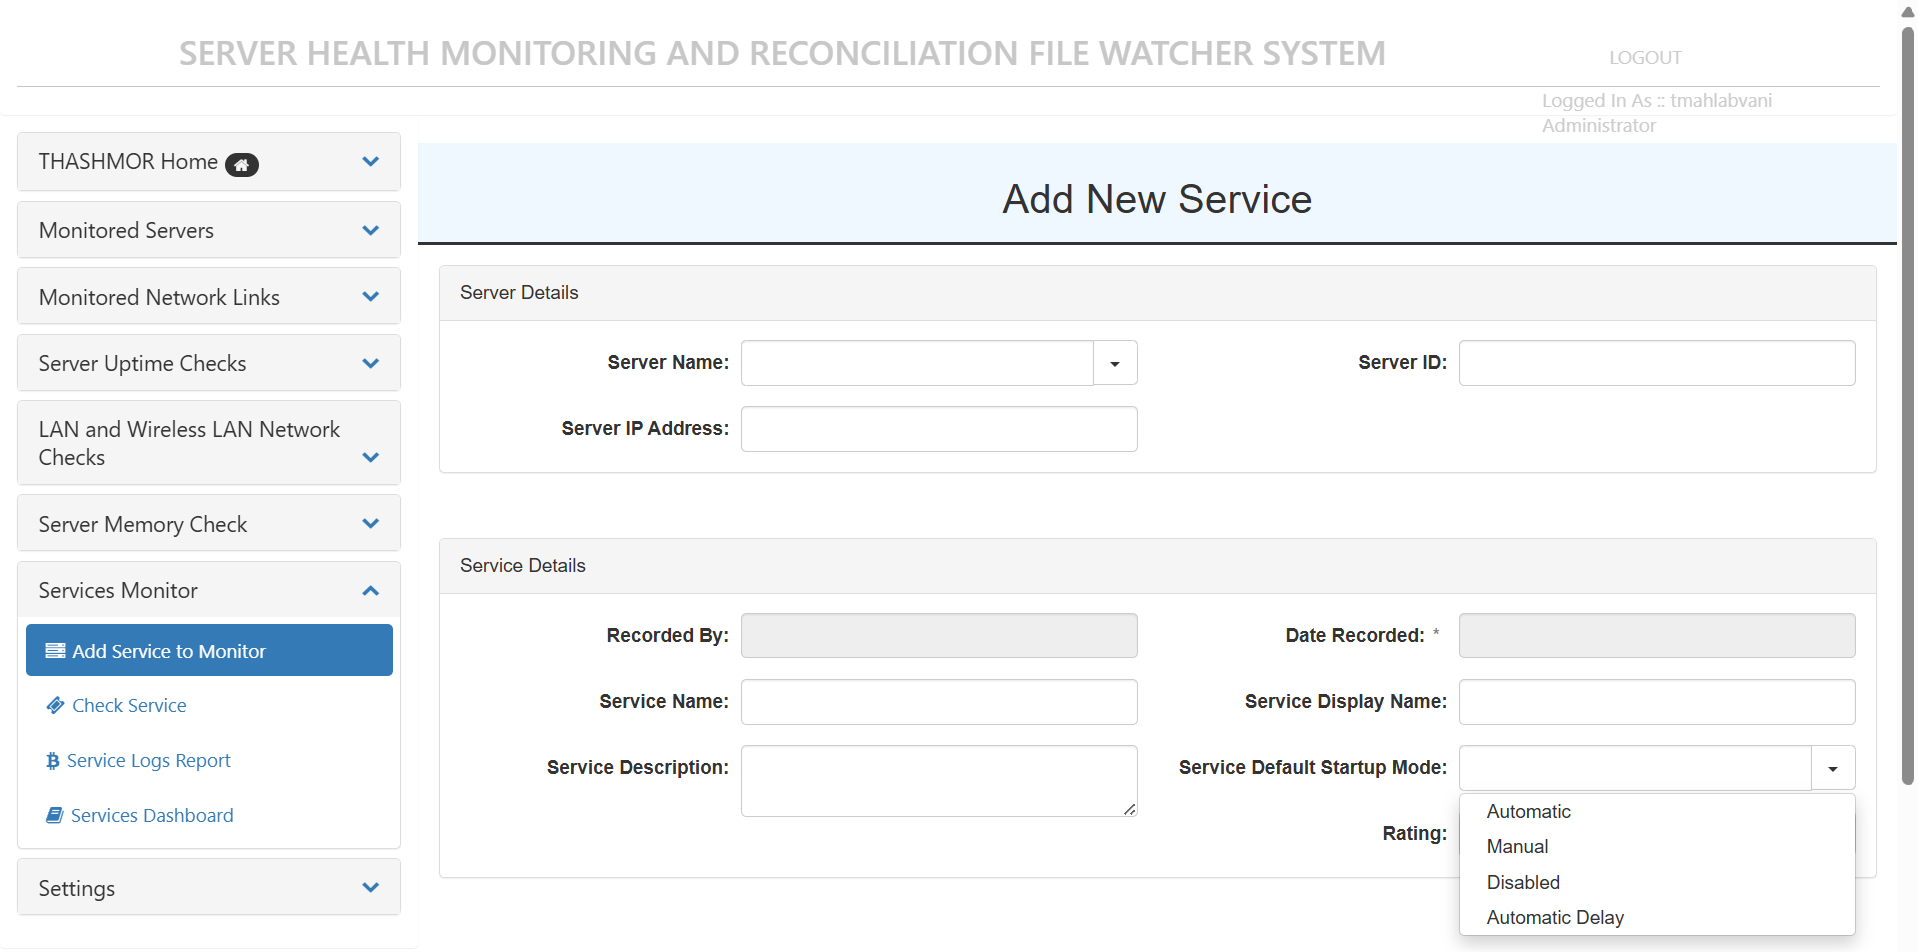
System Interface